Visualising Indices
'Explore the concept of indices by considering what they look like'
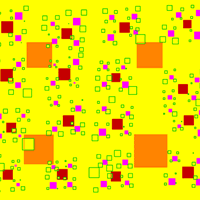
'Squared' and 'Cubed' can be explained by using 2 and 3 dimensions. The area of a square with length 5 is 52, the volume of a cube with side length 7 is 73, so how can we represent 54? This activity explores visual representations of indices and draws on a little creativity! Try and work out what number is represented by the diagrams and then think about how some diagrams for other numbers can be created!
This page addresses the following item from the syllabus:
- Understand and use indices
Resources
There is a worksheet to start this task with  Visualising Indices and some teachers notes Visualising Indices TN
Some Examples


Description
Here is a brief outline of the activity
- Starting with the diagrams above, look for associations. 'What shall I call the picture?'
- Use the attached worksheet to try and work out what numbers are associated with the other pictures and then start being creative!
- Make a nice display of the class's results!
All materials on this website are for the exclusive use of teachers and students at subscribing schools for the period of their subscription. Any unauthorised copying or posting of materials on other websites is an infringement of our copyright and could result in your account being blocked and legal action being taken against you.