Student Survey

This page is dedicated to a collaborative project involving a worldwide student (and teacher) survey. Below you will find a questionnaire that will take 15-20 minutes for students to complete. Teachers may wish to trial the survey first. This is fine, but answer the questions honestly so that we can use the results of teachers too!
The questions have been carefully selected in order to collect 'interesting' and 'worthwhile' data. From experience the students enjoy filling in the survey then comparing themselves to students in other schools and countries.
The Data
The data can be download from ![]() from here
from here
Possible Data Handling Projects
Here are some possible areas of inquiry once the data has been collected
- Is visual acuity related to a) age, b) reaction time, c) amount of time spent playing video games?
- What is the distribution of hours spent playing computer/video games? Is it related to age/gender?
- Is favourite genre of computer/video games related to the platform used to play the game?
- How are favourite sports affected by geographical location?
- Much more...
Ready-Made Activities
Sorting and Filtering
It is quite an important skill to be able to manipulate a large spreadsheet of data. This activity gets students to look at some of the data from the survey. They should download the data first. The students can begin to explore the hypothesis that boys will spend more time playing computer/video games than girls!
Quartiles and Boxplots
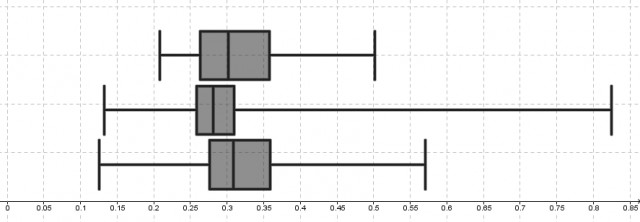
In this activity we will consider whether “Reaction time is dependent upon age”. The data has been divided into groups and ordered to make this more straight forward.


