Olympic Records
'Can you predict the winning times, heights, weights and points for the 2012 Olympics?'
WITHIN the SYLLABUS applications of functions inquiry / enrichment tasks (also includes optional extensions: piecewise and experimenting with transformations using sliders). No application to real-life context questions in exams
Olympic winning performances have been improving at a remarkable rate since the modern games first began in 1896.
Below you have the winning times for the last 30 Olympics in the 100m men and women's event, the men and women's High Jump, Show jumping (one of only two events where men and women compete head to head) and men's heavyweight weightlifting. Can you find a function that models these winning times to predict what this year's 2012 Olympic Games results will be? Perhaps you could run a sweepstake on who predicts the most events, most accurately! This sort of analysis is used by scientists and mathematicians  to try and determine the physical limits of human capabilities, even without any theory. Others start from a theoretical standpoint, and then look at the data to test their theories.
Overview of the Activity
Check "View > Algebra" for the "name" of your list. In recent versions of Geogebra this has changed from the "list1" shown in the video to "l1" etc.
The 100m, High Jump, Show jumping and Weightlifting (heavyweight) events
Resources
Use your knowledge of different functions to find a model for these Olympic gold times, heights, weights and points. You can use Geogebra's own statistics "fitpoly" etc. regression options and/or your own functions. You will need Geogebra Classic 5 (FREE download) or later versions. This activity can be done equally well using Autograph.
 Men's Heavyweight weightlifting
Enter your model's predictions for the  1984 winning results in this spreadsheet and see how close you are to the actual result. Olympic Gold times, weights, points etc. by Sport & Year can be found here. Once you have found a model that you think is a fairly good fit (discuss how you might measure goodness of fit with your teacher) use it to make your predictions for the 2012 Olympic Games!
Geogebra help with sliders and labels
What to do
- I use this with Extended syllabus students so that they understand how functions empower us to make sense of the world we live in and to engage and motivate them to take ownership of their learning.
- You should be familiar with the sine and cosine graphs, quadratics, cubics and linear functions as well as transformations of graphs.
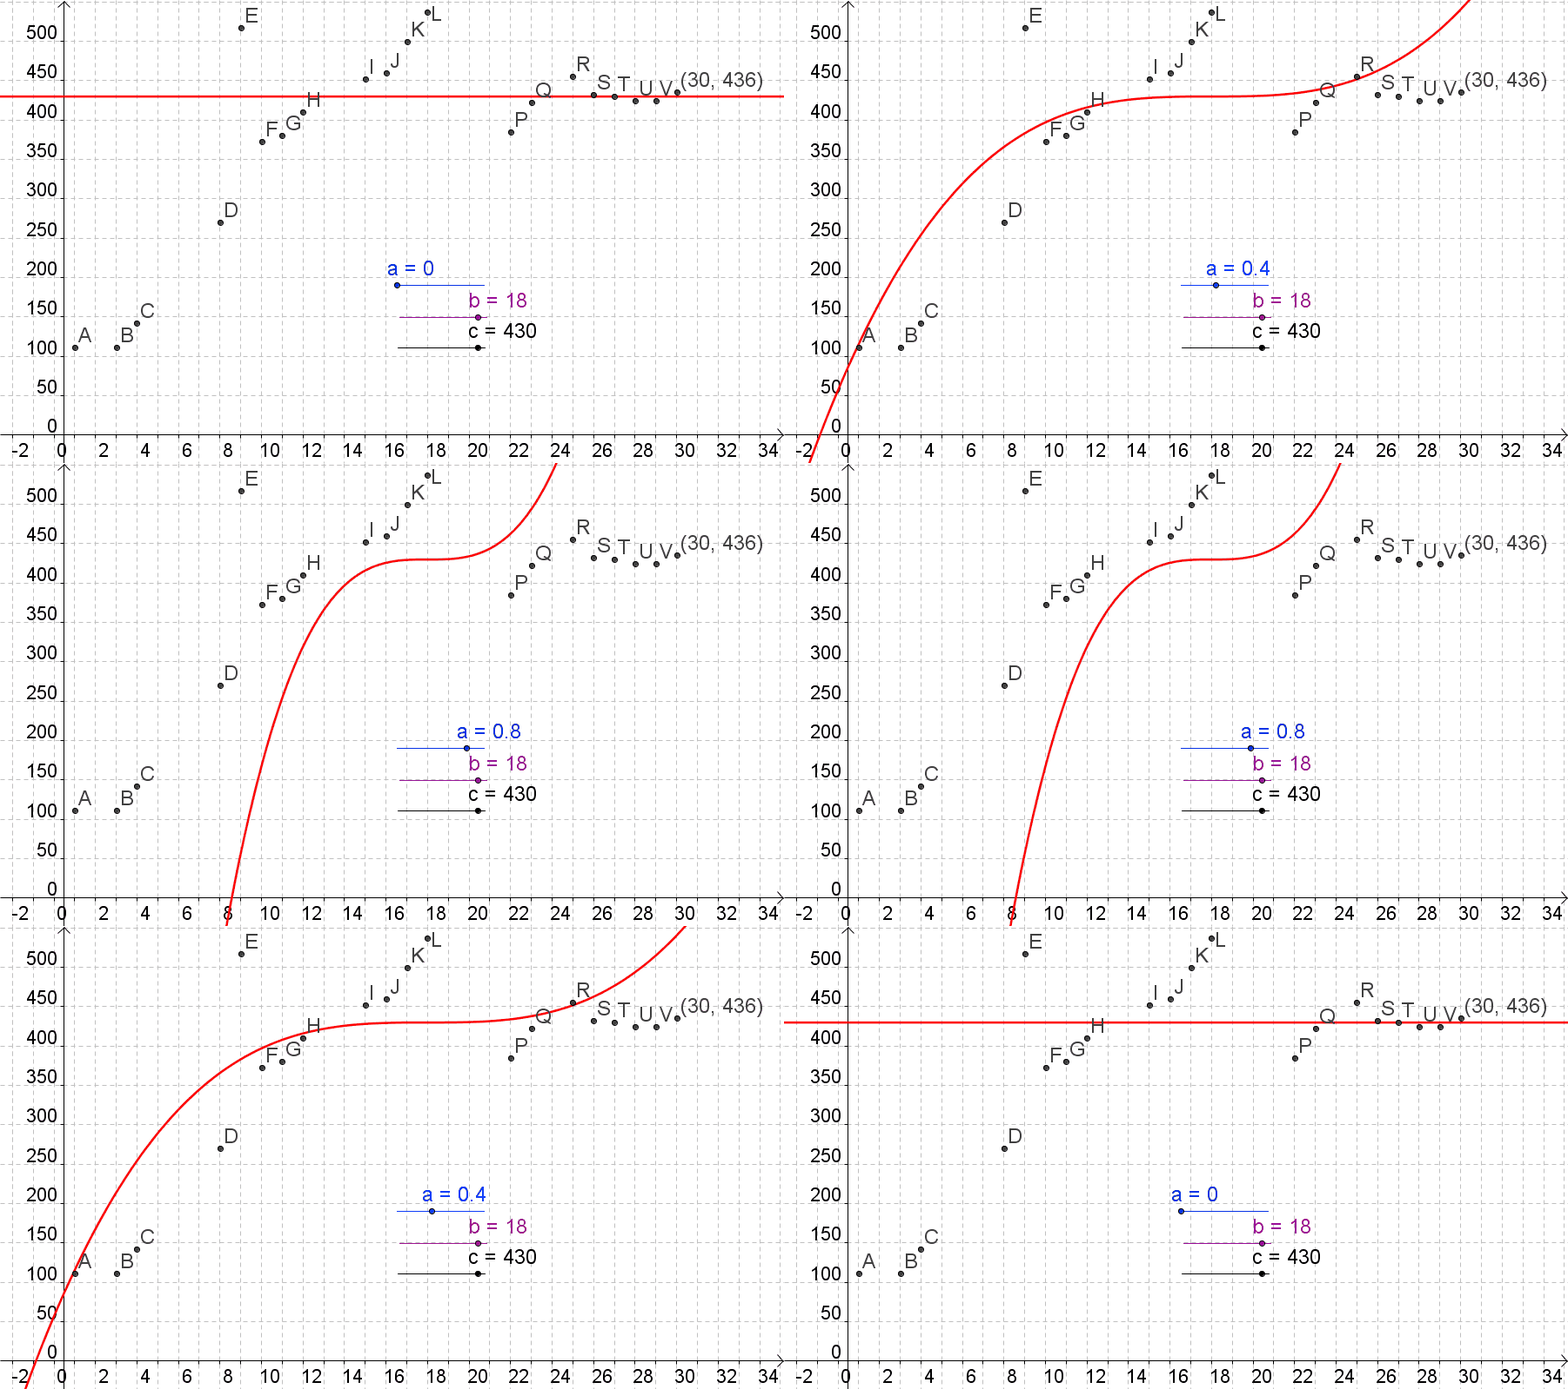
- Open each file in turn, plot the points on the grid and then try to find a function that models the data.
- You can use Geogebra's "fitpoly, fitpow" etc. statistical regression command and/or your own functions using sliders to vary and transform your chosen functions.
- Use your models to predict what the winning result in the 1984 Los Angeles Olympics was (interpolation). Which model is the most accurate predictor for 1984? Don't forget to consider how well it predicts the other results since 1896. It is also worth discussing how accurate you think your model's predictions are for pre-1896 and post-2012 possible results (extrapolation)? Do you think your model will still be a good predictor for the 2100 Olympic games?
- Enter your predictions for the 2012 Games in your spreadsheet. Maybe the class could run a sweepstake on whose models make the most accurate predictions in 2012, 2016 or, eventually, the famously postponed Tokyo Games of 2020/21 !