Travel Graphs

How can you describe your position? What happens when you move?
Can you describe this movement?
This is a really fun practical activity that will get you to do just that.
This page addresses the following items from the syllabus:
Graphs in practical situations
- Use and interpret graphs in practical situations including travel graphs and conversion graphs.
- Apply the idea of rate of change to simple kinematics involving distance–time and speed–time graphs, acceleration and deceleration.
- Calculate distance travelled as area under a speed–time graph.

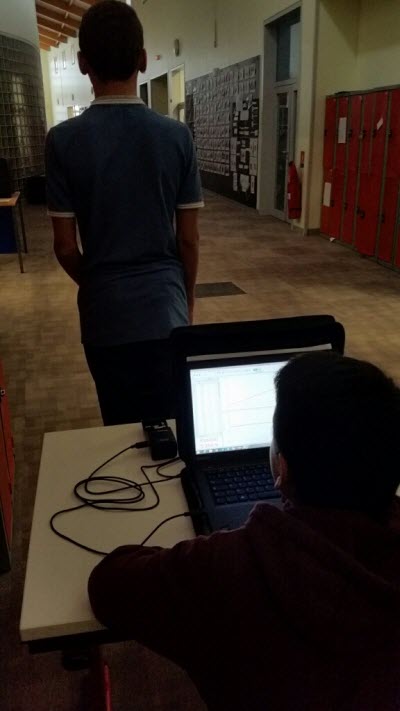
Students using a motion sensor to track their 'journey' and reproduce travel graphs.
Part A - Practical
In the activity below, the idea is to try and reproduce the journeys that were made by the person who recorded these journeys in the first place. The graphs describe the position of a person as time passes. The journeys are made over a few seconds and a few metres.
With Motion Sensors
If you have Vernier Motion Sensor then you will be able to have fun seeing how your journeys compare (see  Teacher notes). These are really easy to set up. Just plug the motion sensor into the USB port of your laptop and off you go
- You can find some simple instructions about
 using the Motion sensor
 - Ignore the squiggles (they are often due to noise interference).
Copy and paste your graphs underneath your teacher’s graphs then write a description of the journeys giving details of any important details. An editable version of
 the worksheet is provided here.
Without Motion Sensors
It is possible to complete the practical part of this activity without the motion sensors. Here are a few suggestions of how this might work.
- At the front of the class, the teacher or a student volunteer produces a journey that they think reproduces one of the journeys. The students then decide which of the graphs best represents this journey.
- As above, but in pairs.
- A graph is displayed on a screen at the front of the class. A volunteer is asked to try and reproduce the journey. Students discuss whether the journey represents that of the graph. The journey could then be refined.
- Students could work in pairs to play a guessing game. Player 1 looks at a graph then makes a journey. Player 2 draws a graph of the journey. They discuss whether their graphs match up.