AIDS-HIV Statistics-TN

Teacher Notes
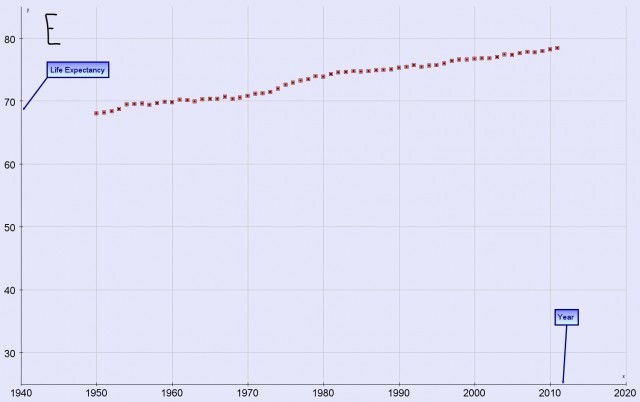
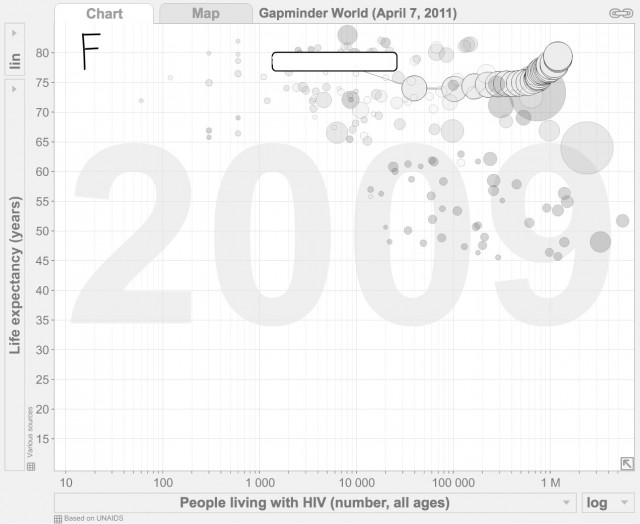
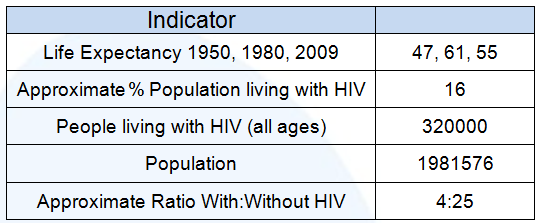
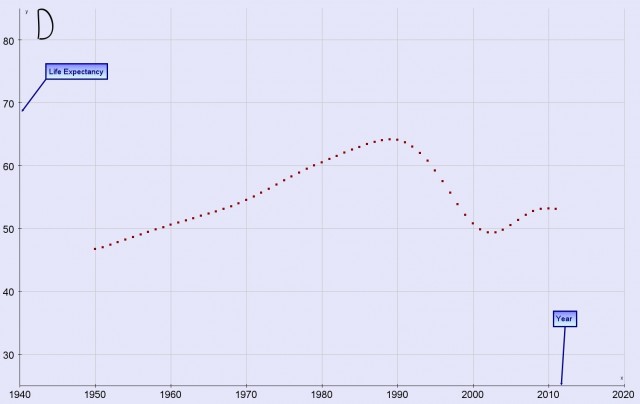
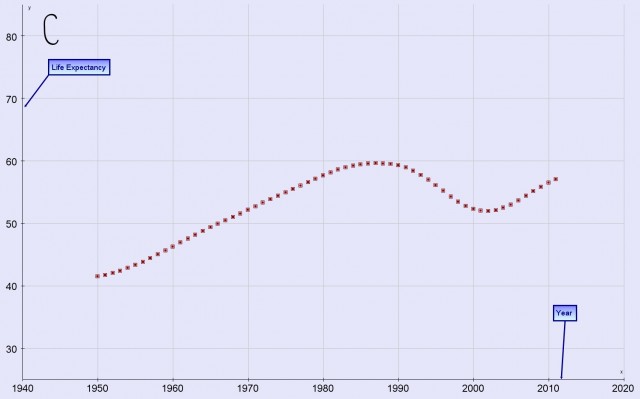
Practice interpreting statistics and graphs, percentages and ratio and have a look at some real data about HIV and AIDS worldwide. Students are given eight pieces of information about eight different countries and asked to sort them in to a different group for each country. Statistics tell stories and this exercise is designed to help students learn about some of the stories related to HIV and AIDS over the last 50 years and up to present day. The real activity here is the reasoning that students will have to use to match up the different data cards. They will have to read and interpret carefully and use logical deduction to put the groups together. In doing so they will naturally discover some of the patterns in the data that reveal the impact HIV and AIDS has had in different places around the world.
What follows are the solutions to the sorting exercise! Use the page contents menu on the top right to jump quickly to a country.
Clues
The task is possible through logical deduction alone but teachers may choose to drop in a few bits of information for clues as and when the feel appropriate. This depends on the class and the time available, but it is quite a challenge without any extra clues. After a certain time, teachers may also decide to let students have access to ![]() Gapminder to look at some of the stats for themselves.
Gapminder to look at some of the stats for themselves.
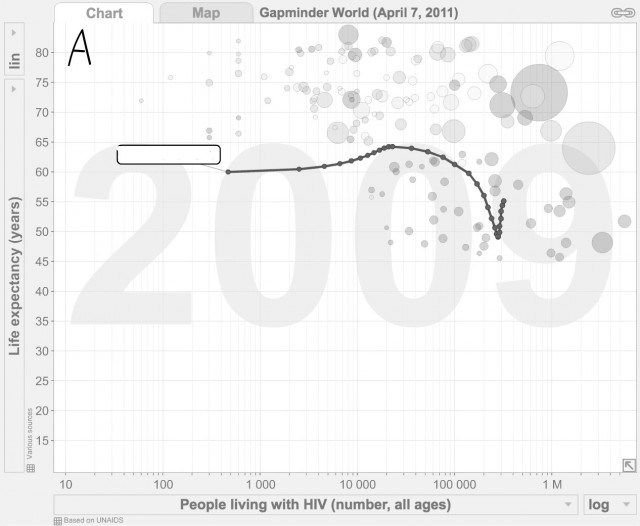
 Botswana
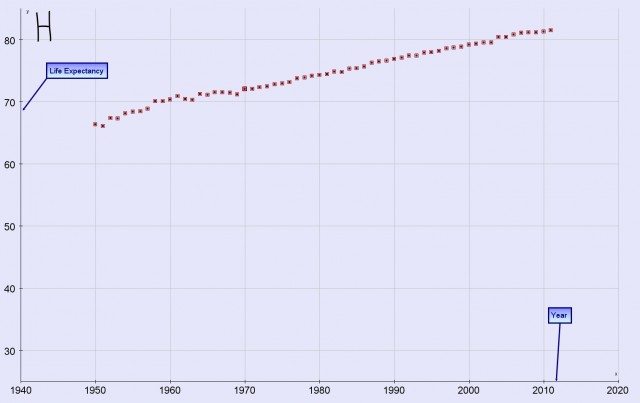
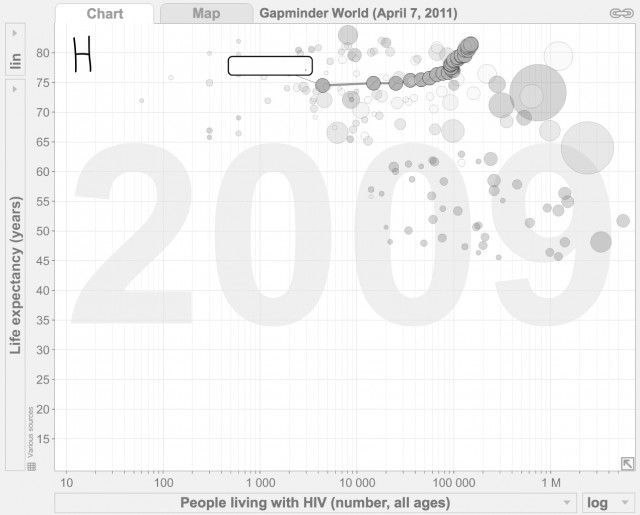
 France

.jpeg) India
India

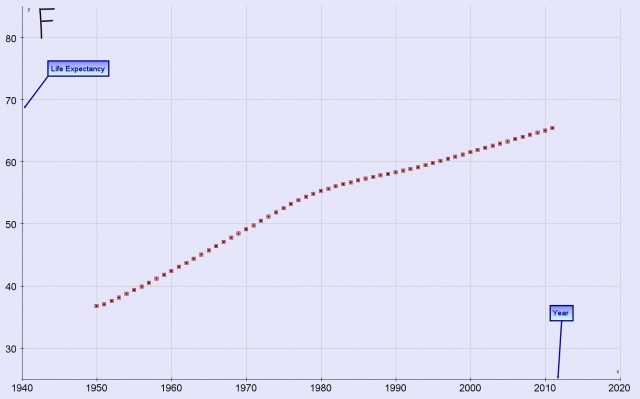
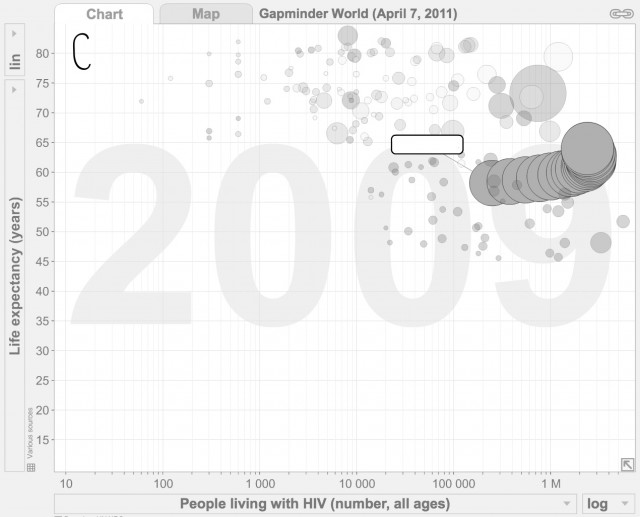
.jpeg) Kenya
Kenya

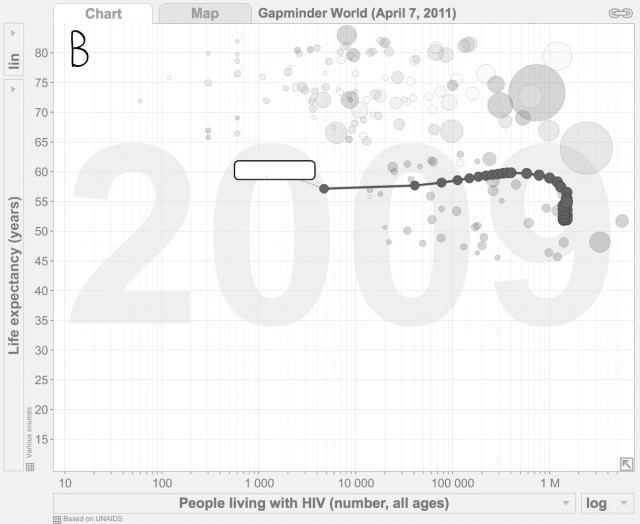
.jpeg) Russia
Russia

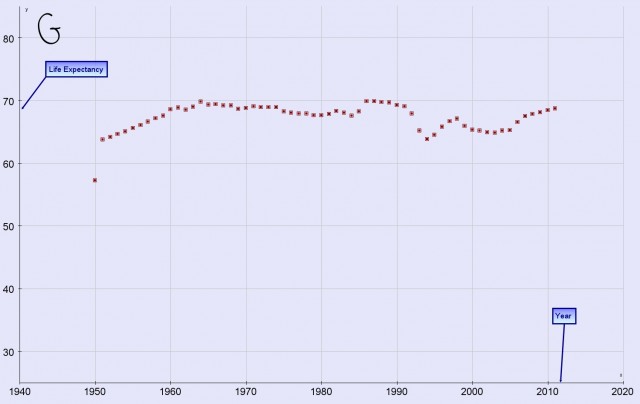
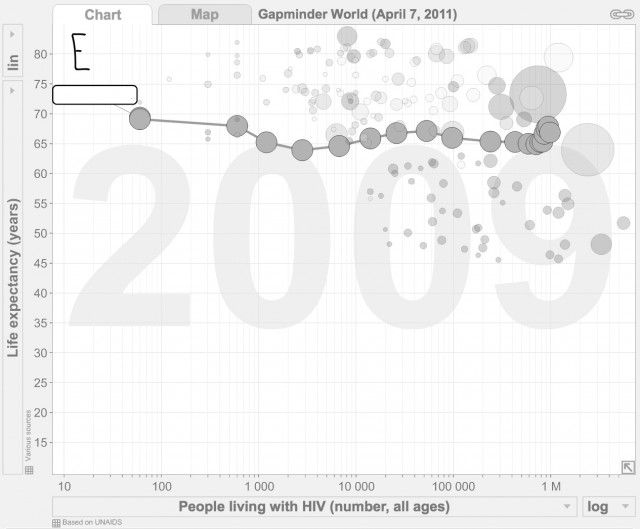
 South Africa

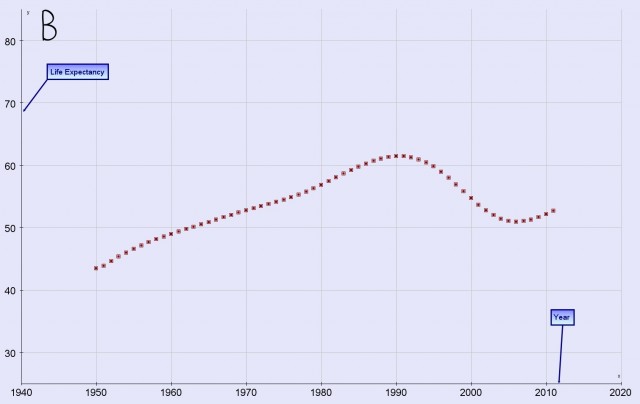

.jpeg) United Kingdom
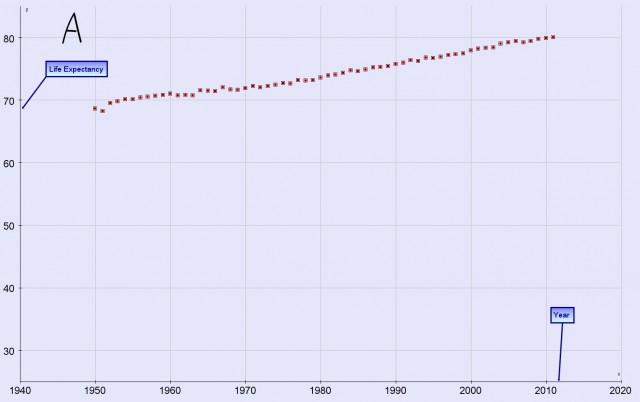
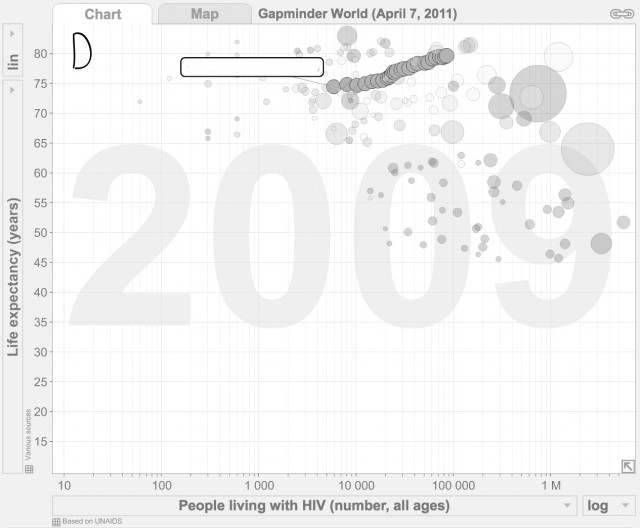
United Kingdom

 USA
USA

