Double Spinners
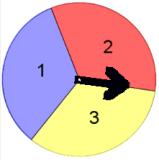
What is random? How can we be sure that when we spin a spinner we do it randomly? How can we predict events that are random? You should consider and answer these questions and many more during this activity. Here you are encouraged to create and program your own virtual spinner that should behave randomly. You will test it out and share results with your classmates. Can you predict the results of the spinner from what you know about probability? If you carry out the experiment more and more times what is likely to happen to your results?
This page addresses the following item from the syllabus:
Relative and expected frequencies
- Understand relative frequency as an estimate of probability.
The following slideshow should give teachers an idea what this activity entails:
Resources
Here is the associated worksheet  Comparing Theory with Experimental Data.
An online version of Scratch can be used from here (no download needed)  scratch.mit.edu
A short help video for using scratch is provided below.
Alternatively, if you are not creating the spinners you can use the Scratch Spinners applet below.
The teacher can collect all the individual students’ results in this ready prepared spreadsheet  spinner collection.
Scratch Help Video
Here is a short video to show how to move the scripts around to create the spinners in scratch:
Scratch Spinners
If you are not creating the scratch file for yourself you may wish to use the following applet that simulates the two spinners. Click on the arrows to make them spin.
Description
Here follows an outline of what the task is.
- Students should consider what all the possible outcomes are from spinning these two spinners and adding the results.

- The scripts will need to be correctly ordered to create two different spinners.
- Experimental data should be collected and compared to predictions.
- Data could be shared with the whole group so that a group discussion of what happens to experimental probability as the number of times an experiment is carried out increases. A ready made spreadsheet with pre-programmed graphs is available to help with this.
- Other experiments could be compared – finding the difference of the spinners instead of the sum and creating biased spinners.