Core Probability with Venn Diagrams
The following are 10 onscreen quiz CORE questions to address the syllabus items:
Calculate the probability of combined events using Venn diagrams
These can be set for students using student access and feedback is instant.
A Venn diagram shows information about 20 students who like tea (T) and coffee (C).
A student is chosen at random.
Find the probability that the student likes tea.
Write your answer as a fraction in the simplest form.
Probability = \(\frac{a}{b}\)
a =
b =
6 students like only tea.
4 students like both tea and coffee.
So 10 students like tea.
Probability =\(\frac{10}{20}=\frac{1}{2}\)
A Venn diagram shows information about pupils who play football (F) and basketball (B).
A pupil is chosen at random.
Find the probability that the pupil plays basketball.
Write your answer as a fraction in the simplest form.
Probability = \(\frac{a}{b}\)
a =
b =
4 pupils play only basketball.
7 pupils play both football and basketball.
So 11 pupils play basketball.
Probability =\(\frac{11}{30}\)
A Venn diagram shows information about 40 people who speak French (F) and Spanish (S).
One person is chosen at random.
Find the probability that the person speaks both French and Spanish.
Write your answer as a fraction in the simplest form.
Probability = \(\frac{a}{b}\)
a =
b =
8 people speak both French and Spanish.
There are 40 people in total.
Probability =\(\frac{8}{40}=\frac{1}{5}\)
A group of 50 students are asked whether they like maths (M) or science (S). The Venn diagram below is blank.
18 students like maths.
25 students like science.
9 students like both maths and science.
A student is chosen at random.
Find the probability that the student likes neither maths nor science.
Write your answer as a fraction in the simplest form.
Probability = \(\frac{a}{b}\)
a =
b =
Here is the completed Venn diagram
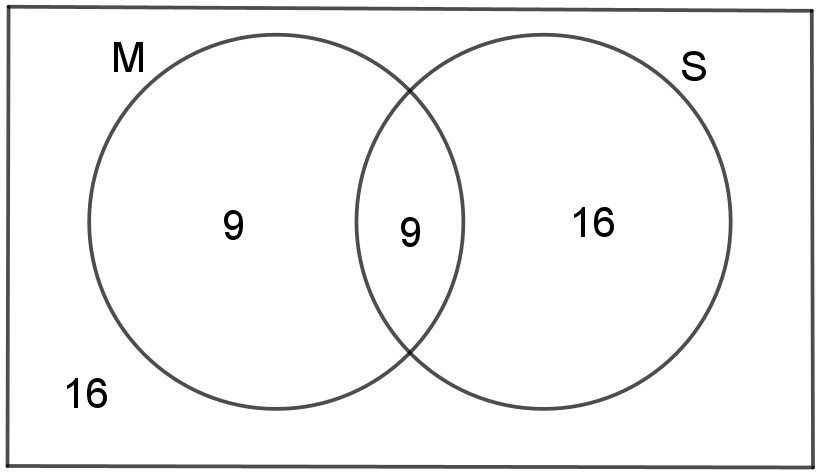
Probability =\(\frac{16}{50}=\frac{8}{25}\)
A Venn diagram shows information about 40 cars checked by a police officer. T means an illegal tyre and L means a faulty light.
A car is chosen at random.
Find the probability that the car has exactly one fault.
Write your answer as a fraction in the simplest form.
Probability = \(\frac{a}{b}\)
a =
b =
Exactly one fault means tyre only or light only.
Tyre only = 8 and light only = 12.
So 20 cars have exactly one fault.
Probability =\(\frac{20}{40}=\frac{1}{2}\)
The Venn diagram below is blank. It represents members who use the gym (G) and the swimming pool (S).
22 members use the gym.
30 members use the swimming pool.
12 members use both.
8 members use neither.
A member is chosen at random.
Find the probability that the member uses the gym but not the swimming pool.
Write your answer as a fraction in the simplest form.
Probability = \(\frac{a}{b}\)
a =
b =
The completed Venn diagram looks like this
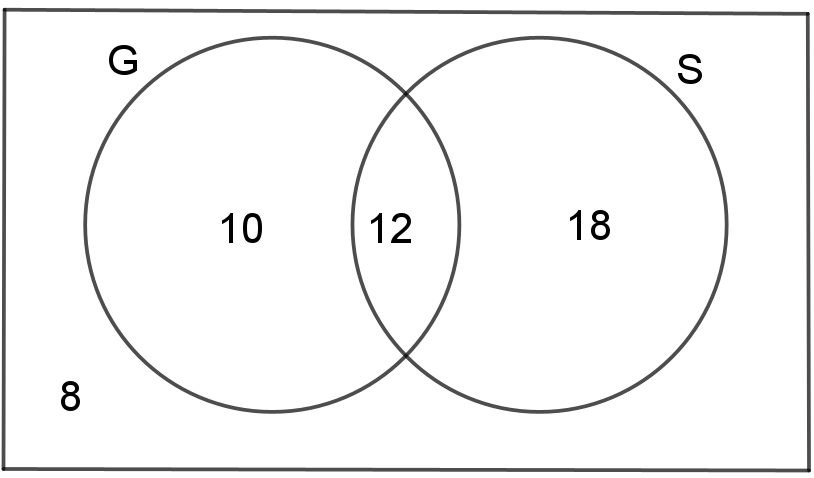
Total members = (22 + 30 − 12) + 8 = 48.
Probability =\(\frac{10}{48}=\frac{5}{24}\)
A Venn diagram shows information about 30 students who study History (H) and Geography (G).
A student is chosen at random.
Find the probability that the student studies exactly one of the subjects.
Write your answer as a fraction in the simplest form.
Probability = \(\frac{a}{b}\)
a =
b =
History only = 9.
Geography only = 13.
So 22 students study exactly one subject.
Probability =\(\frac{22}{30}=\frac{11}{15}\)
A Venn diagram shows information about gardeners who grow melons (M), potatoes (P) and carrots (C).
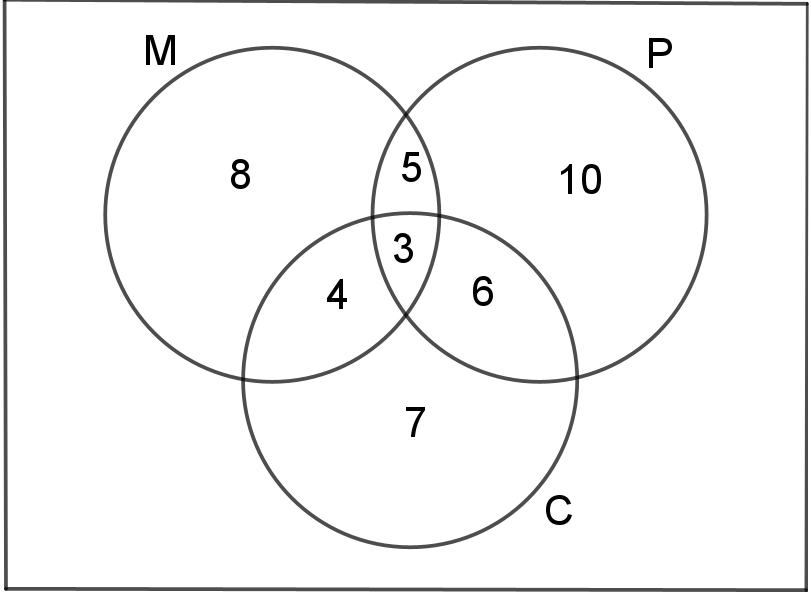
Given that a gardener grows melons, find the probability that this gardener does not grow carrots.
Write your answer as a fraction in the simplest form.
Probability = \(\frac{a}{b}\)
a =
b =
Total gardeners who grow melons = 20.
Those who do not grow carrots = 8 + 5 = 13.
Probability =\(\frac{13}{20}\)
A Venn diagram shows the number of members using the exercise machines (E), the swimming pool (S) and the tennis courts (T).
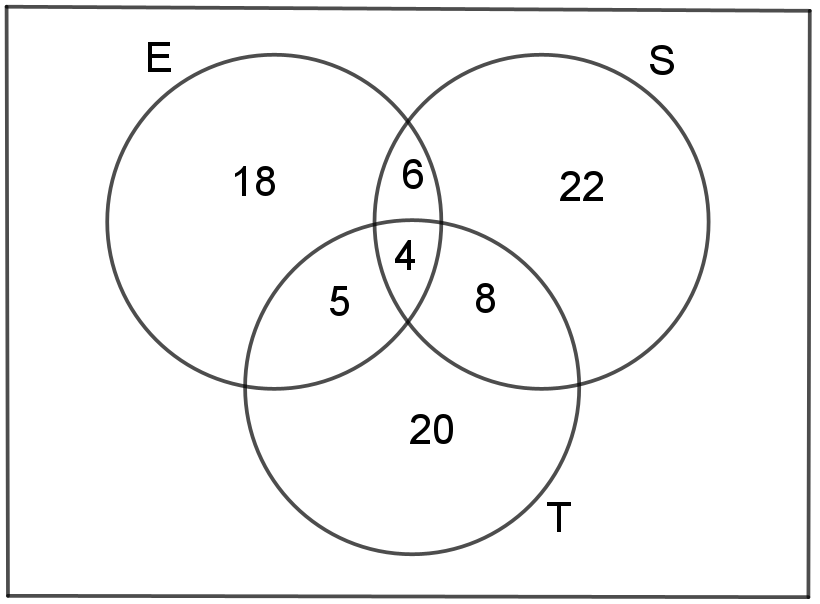
Given that a member who uses the swimming pool, find the probability that this member also uses the tennis courts and the exercise machines.
Write your answer as a fraction in the simplest form.
Probability = \(\frac{a}{b}\)
a =
b =
Total swimming pool users = 40.
Those who use all three facilities = 4.
Probability =\(\frac{4}{40}=\frac{1}{10}\)
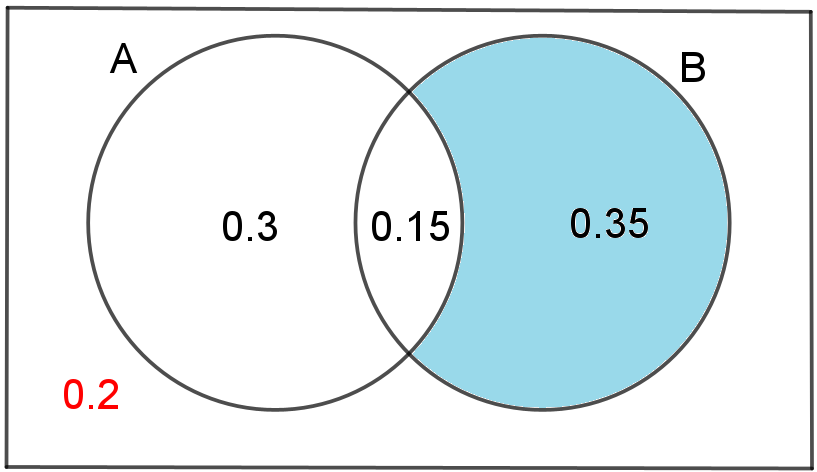
A Venn diagram shows the probabilities of two events, A and B.
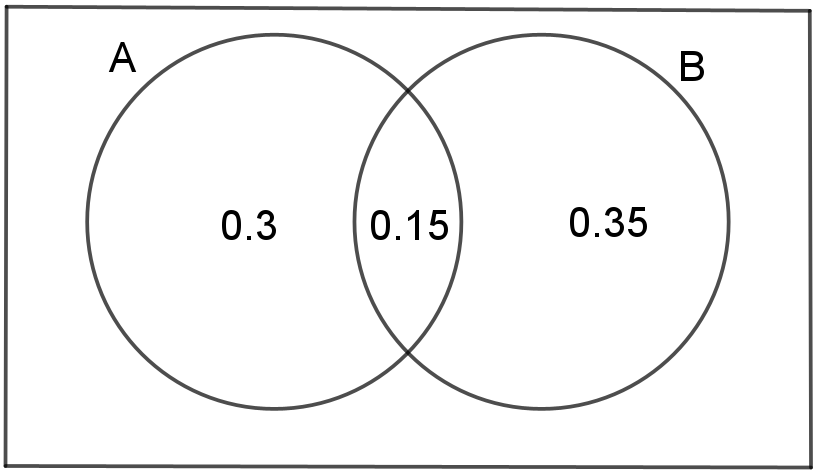
Work out \(P(A' \cap B)\).
Write your answer as a decimal
Probability =
Work out the probability of the missing region
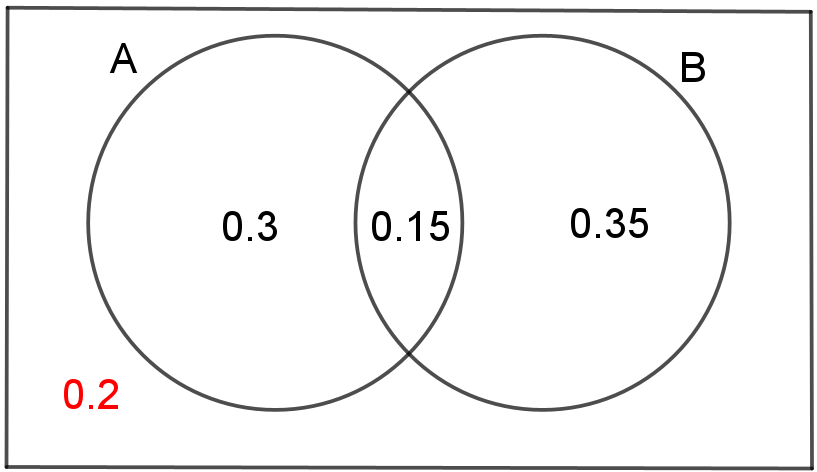
\(P(A' \cap B)\).is the intersection of A' and B