Interpreting World Statistics

'What impact have key events had on the health and wealth of nations over the last 200 years?'
This activity makes use of the 'awesome' (a word that should be used less but is totally appropriate here) ![]() Gapminder World resource. The resource enables us to look back at 200 years worth of world statistics about population, GDP and life expectancy (and much, much more). The activity is all about how we can interpret those statistics and answer some key questions like the one above! We are also asked to test and challenge our perceptions of countries and histories by looking at some real statistics. One of the key questions being asked in this activity is about the effect that World War Two had on development. Was the war a crucial period of development for the world and did we emerge a more sophisticated society as a result of it, in spite of it or not at all? None of these questions can be considered without examining the price that was paid.
Gapminder World resource. The resource enables us to look back at 200 years worth of world statistics about population, GDP and life expectancy (and much, much more). The activity is all about how we can interpret those statistics and answer some key questions like the one above! We are also asked to test and challenge our perceptions of countries and histories by looking at some real statistics. One of the key questions being asked in this activity is about the effect that World War Two had on development. Was the war a crucial period of development for the world and did we emerge a more sophisticated society as a result of it, in spite of it or not at all? None of these questions can be considered without examining the price that was paid.
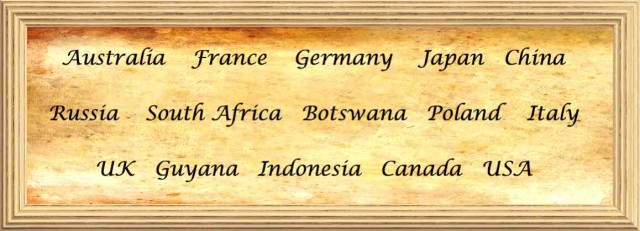
The following scatter graphs show how life expectancy and GDP per capita have changed over a period of 200 years for a number of countries. The task is really quite simple - can you match the graph with a country from the list below?
Images are screen shots from www.gapminder.org altered to conceal some information and add mystery

Resources
The following ![]() World Statistics activity sheet outlines the following task in printable form (it is embedded below). The scattergraphs above can all be viewed on this Scattergraphs - 15 Countries page (answers at the bottom) or they can be printed as either
World Statistics activity sheet outlines the following task in printable form (it is embedded below). The scattergraphs above can all be viewed on this Scattergraphs - 15 Countries page (answers at the bottom) or they can be printed as either ![]() Big Scattergraphs or
Big Scattergraphs or ![]() Small scattergraphs. (If they are then laminated and cut out they can be kept for further use.) For the second part of the activity, students will need access to
Small scattergraphs. (If they are then laminated and cut out they can be kept for further use.) For the second part of the activity, students will need access to ![]() Gapminder World or teachers will have run this from the front if computers are not available. Just choose a country from the menu on the right and click play on the graph.
Gapminder World or teachers will have run this from the front if computers are not available. Just choose a country from the menu on the right and click play on the graph.
The Tasks
The tasks are outlined in this activity sheet. (This can be printed from the link above)
Description
The following is a brief outline of the activity
- Students attempt to match the 15 graphs with the 15 countries. This can be done either with printed graphs or on computers using these pages.
- There should be some rich discussion as this unfolds.
- Students match significant events in history with features of the graphs.
- Students pay particular attention to the periods before, during and after World War 2.
- Based on these findings, the tackle the key question about the development around the time of World War 2.
